


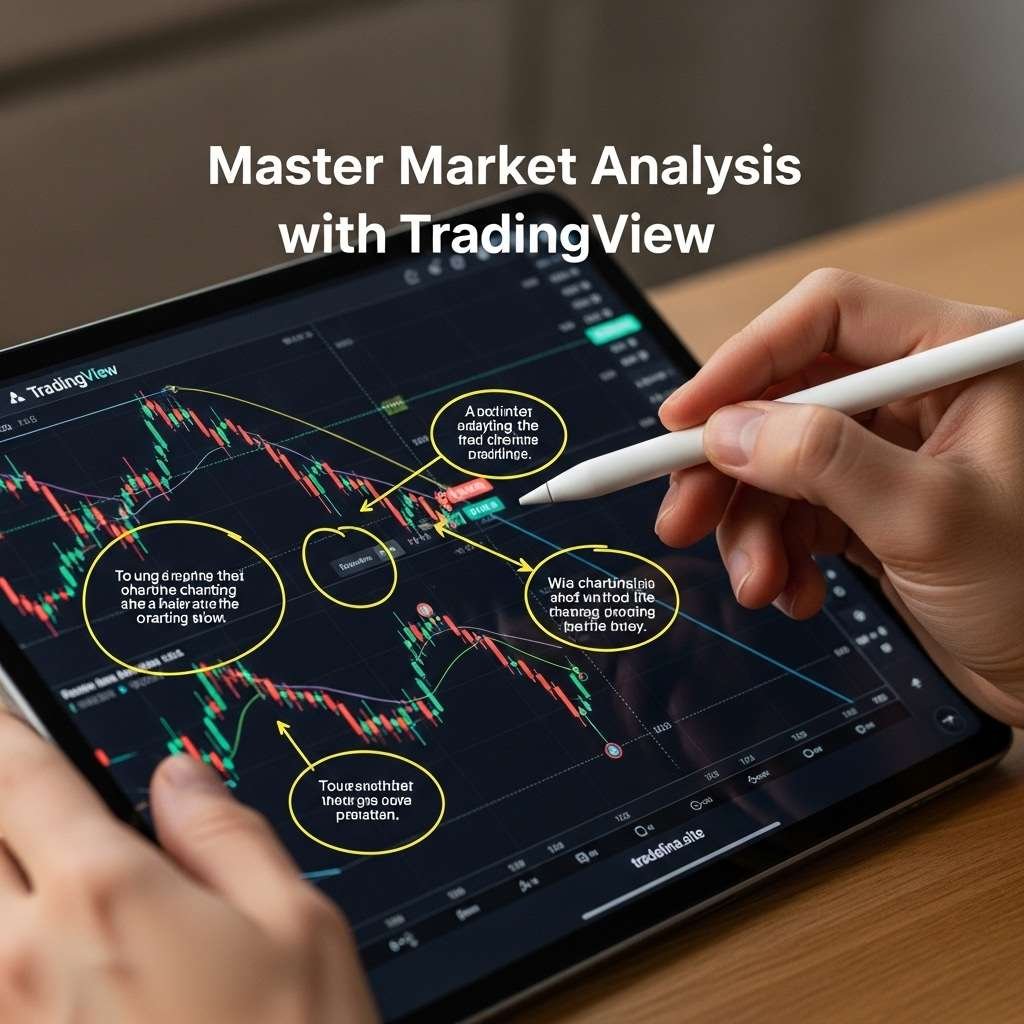
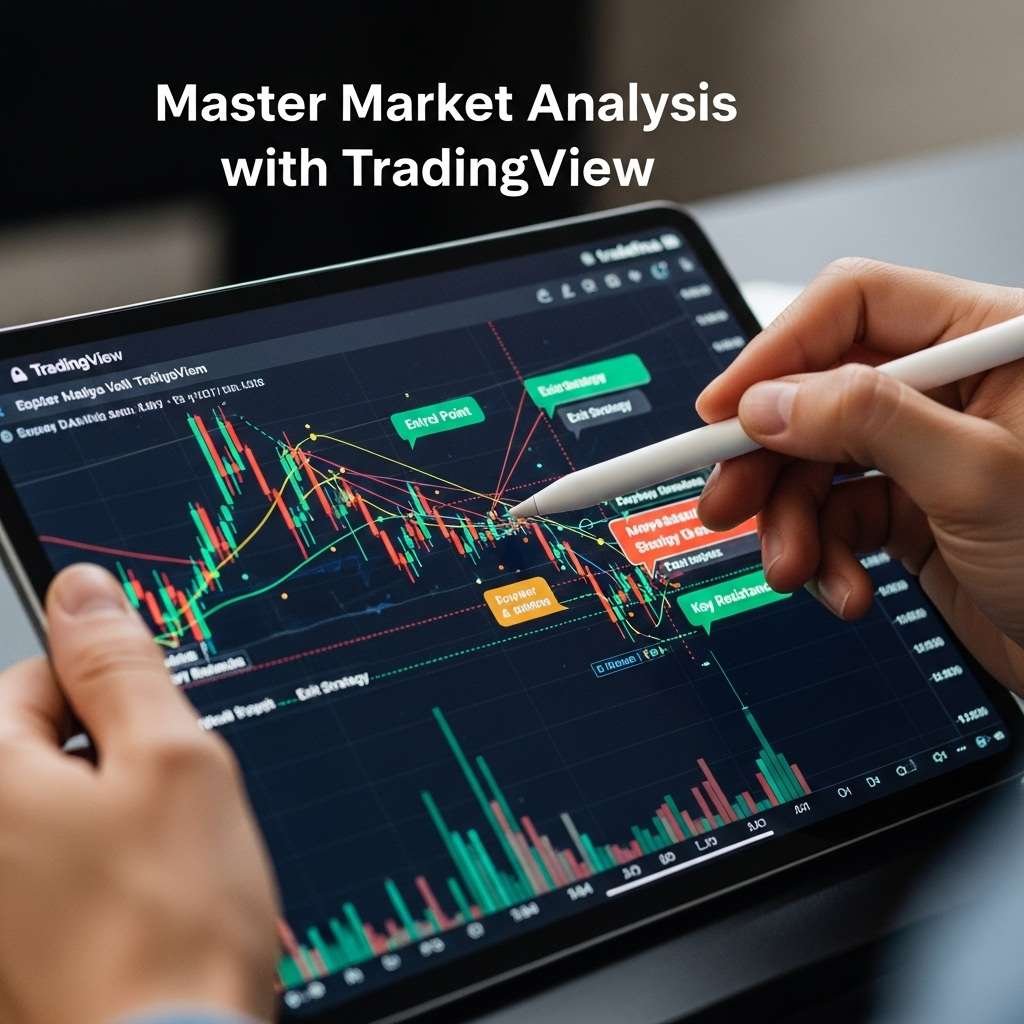
Trading View is one of the most powerful charting and market analysis platforms available for traders and investors. It offers real-time stock data, technical indicators, social trading ideas, and customizable charts. Whether you are a beginner or an experienced trader, Trading View can help you make better decisions by providing clarity on price trends, patterns, and market sentiment. This guide explains how to use Trading View effectively for market analysis in the U.S. markets.
Table of Contents
Why TradingView is Popular
TradingView stands out for several reasons:
- Cloud-Based Platform: Access charts and analysis from any device with internet access
- Real-Time Data: U.S. and global market data with minimal delay
- Advanced Charting Tools: Hundreds of indicators, drawing tools, and overlays
- Social Trading Features: Share and view trading ideas from the community
- Custom Alerts: Notifications for price levels, indicator signals, or trend breaks
These features make TradingView suitable for both technical traders and long-term investors looking to track market trends.
Step 1: Setting Up Your TradingView Account
- Visit TradingView.com and create an account.
- Choose a plan: Free, Pro, Pro+, or Premium. The free version offers most basic tools; paid plans unlock advanced indicators, multiple charts per layout, and faster data.
- Customize your profile and notifications to stay updated on price movements or market news.
Step 2: Navigating the TradingView Interface
The TradingView dashboard has several key components:
- Chart Area: Central section to view stock or asset price movements
- Toolbar: Left-hand side with drawing tools for trendlines, Fibonacci retracements, and shapes
- Indicators & Strategies: Top toolbar to add technical indicators like RSI, MACD, or moving averages
- Watchlist: Right-hand panel to track favorite stocks, ETFs, or cryptocurrencies
- Social Feed: Community ideas, charts, and trading strategies
Familiarizing yourself with the interface helps you work efficiently and execute analysis faster.

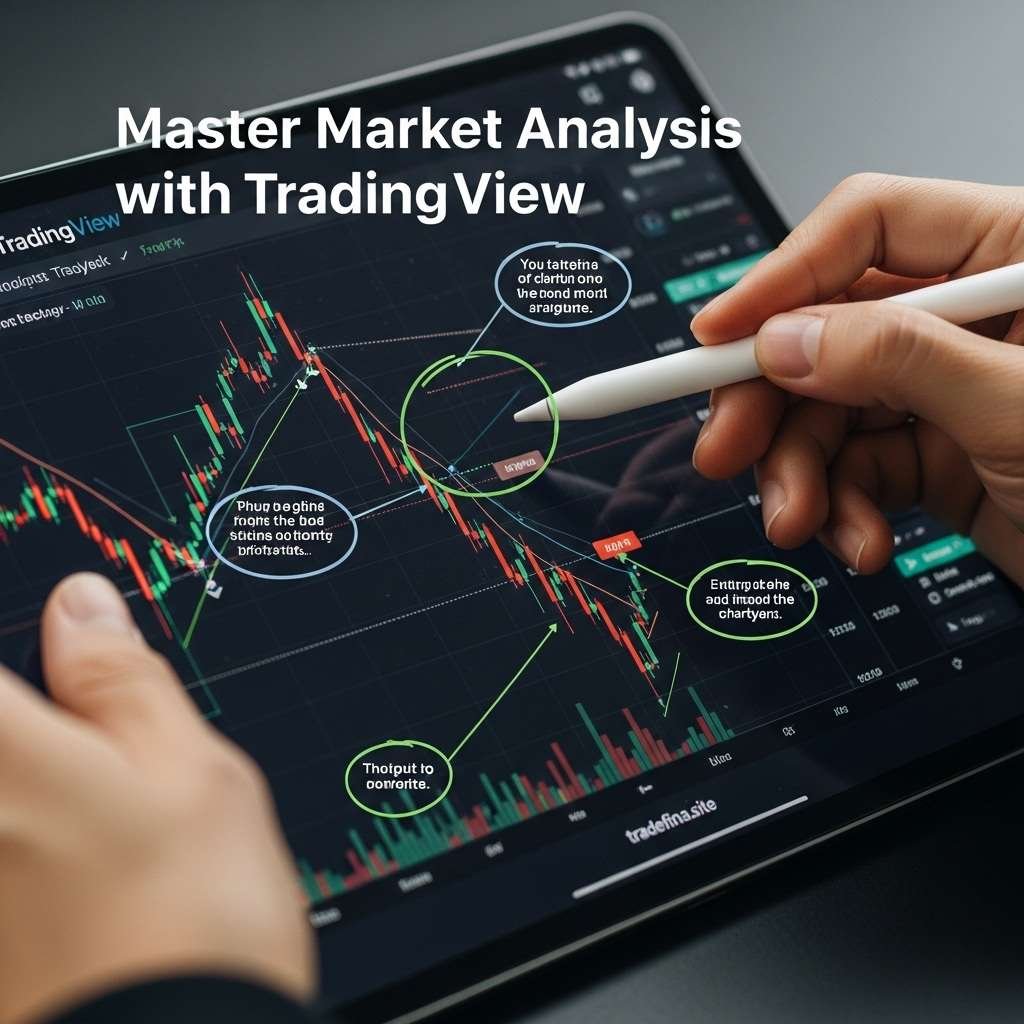
Step 3: Using Charts for Market Analysis
TradingView offers multiple chart types:
- Candlestick Charts: Most popular, showing open, high, low, and close prices
- Line Charts: Connects closing prices over time for a simpler view
- Bar Charts: Visualize price range for each period
- Heikin-Ashi Charts: Smooths price action to identify trends more clearly
For beginners, candlestick charts with a few key indicators are usually sufficient to start analyzing trends and making informed decisions.
Step 4: Applying Technical Indicators
Indicators help you understand market momentum, trend strength, and potential reversals. Common indicators in TradingView include:
- Moving Averages (SMA/EMA): Show average prices over a period to identify trends
- Relative Strength Index (RSI): Measures overbought or oversold conditions
- MACD (Moving Average Convergence Divergence): Highlights trend changes and momentum
- Bollinger Bands: Identify volatility and potential breakout points
Add indicators by clicking the “Indicators” button at the top, search for the indicator name, and adjust parameters to suit your trading style.
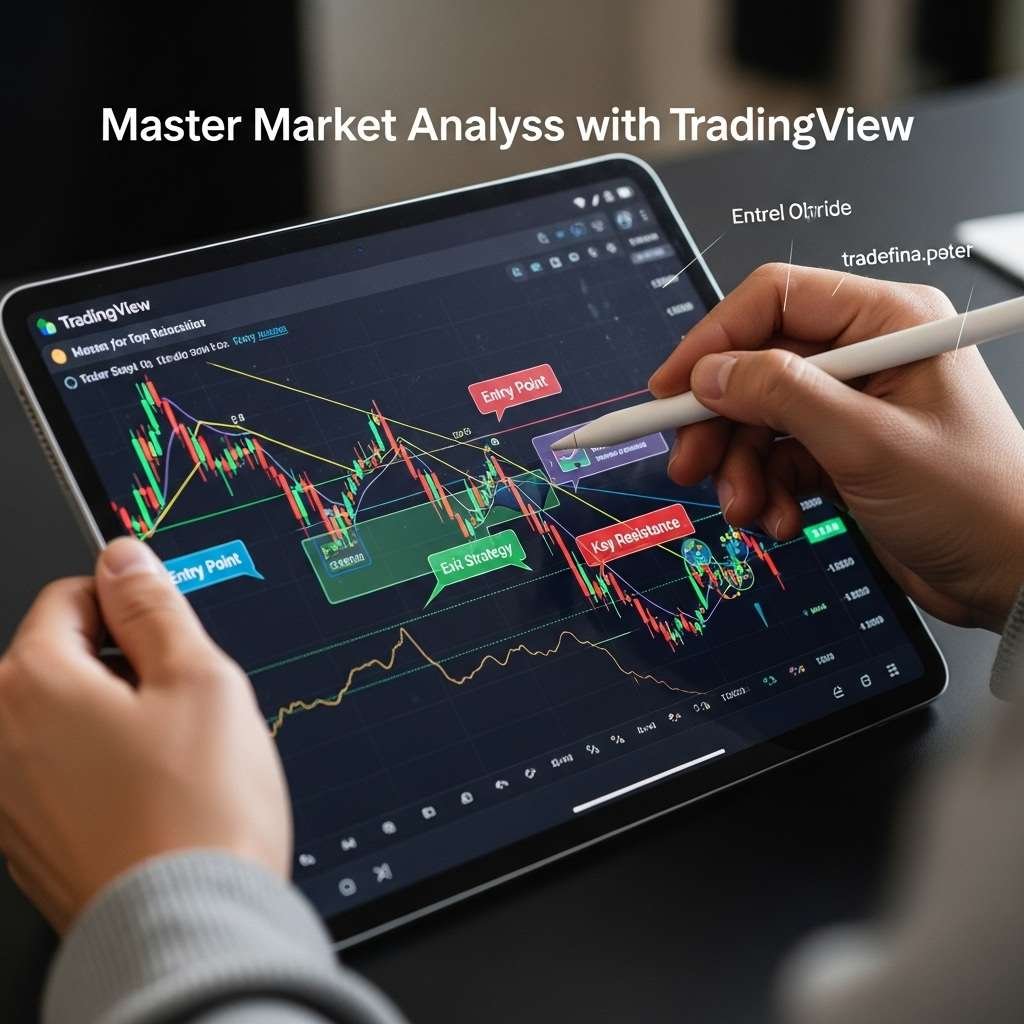
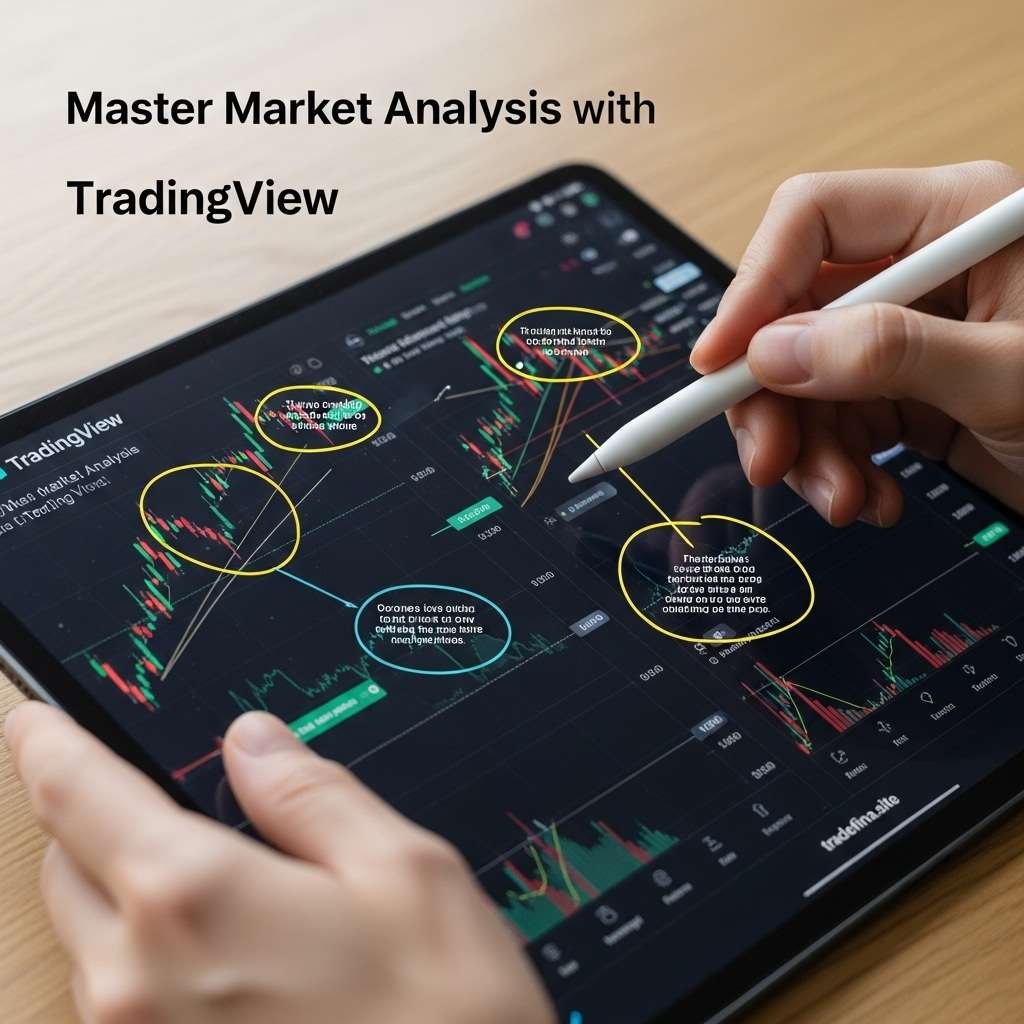
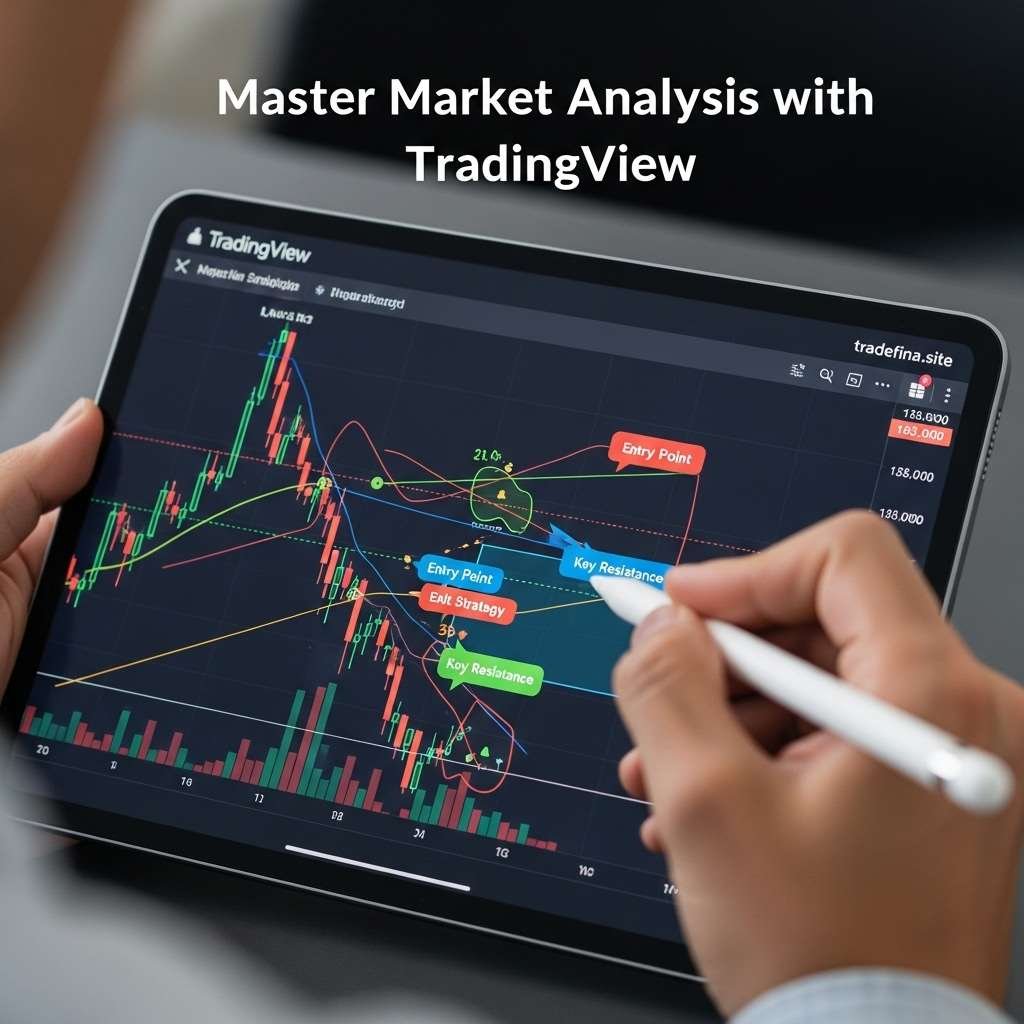
Step 5: Drawing Trendlines and Patterns
Visual tools in TradingView help identify key support and resistance levels:
- Trendlines: Connect highs and lows to track price trends
- Horizontal Lines: Identify support and resistance zones
- Fibonacci Retracement: Forecast potential price reversal points
- Shapes & Annotations: Mark key price levels or chart patterns for future reference
Using drawings effectively can improve your market timing and reduce emotional decision-making.
Step 6: Setting Alerts and Notifications
TradingView allows you to create alerts based on price, indicators, or custom conditions:
- Price crosses a specific level
- RSI reaches overbought/oversold conditions
- MACD signals a potential reversal
Alerts can be sent via email, SMS, or push notifications on your phone, ensuring you never miss a critical market movement.
Step 7: Leveraging Social Trading
TradingView’s social community provides valuable insights:
- Trading Ideas: Users post charts and strategies for discussion
- Scripts & Indicators: Access free or paid custom scripts created by other traders
- Follow Top Traders: Learn techniques from experienced analysts
- Comment & Collaborate: Engage with others to refine your analysis
While social ideas are helpful, always validate them with your own analysis before trading.
Step 8: Using TradingView for Multi-Timeframe Analysis
Multi-timeframe analysis allows traders to understand both short-term and long-term trends:
- Short-Term Charts: 1-minute, 5-minute, or 15-minute charts for day trading
- Medium-Term Charts: 1-hour or 4-hour charts for swing trading
- Long-Term Charts: Daily, weekly, or monthly charts for position trading
Analyzing multiple timeframes reduces risk and improves accuracy in predicting market movements.
Step 9: Paper Trading on TradingView
Paper trading lets beginners practice without risking real money:
- Enable paper trading from the TradingView dashboard
- Simulate buying and selling positions using virtual funds
- Track profits, losses, and performance metrics
- Refine strategies before moving to live trading
Paper trading is essential for building confidence and understanding how indicators and alerts work in real-market conditions.
Step 10: Tips for Beginners Using TradingView
- Start with a clean chart layout and a few key indicators
- Focus on a small set of assets to avoid analysis paralysis
- Use alerts to stay disciplined and reduce emotional decisions
- Combine technical analysis with market news and fundamentals
- Review charts daily to identify recurring patterns and trends
Following these tips will help beginners maximize TradingView’s tools for consistent market analysis.

Comparison Table: Key TradingView Features for Beginners
| Feature | Purpose | Best For | Notes |
|---|---|---|---|
| Candlestick Charts | Track price movements | Trend identification | Most commonly used chart type |
| Indicators (RSI, MACD) | Analyze momentum and trend strength | Technical analysis | Start with 1–3 indicators |
| Drawing Tools | Mark support, resistance, patterns | Visual strategy planning | Trendlines, Fibonacci, shapes |
| Alerts & Notifications | Get notified of price or indicator moves | Timely trading decisions | Email, push notifications |
| Paper Trading | Practice without real money | Beginners | Test strategies before live trades |
Final Thoughts
TradingView is an essential tool for traders and investors in U.S. markets, offering advanced charting, technical analysis, and community insights. Beginners can benefit by starting with simple charts, a few key indicators, and paper trading. By using alerts, drawings, and multi-timeframe analysis, you can make informed trading decisions and develop a disciplined approach to the markets. With consistent practice and study, TradingView can become a powerful platform for understanding trends, managing risk, and improving trading results.
